AI Application Observability: What to Log, Alert, and Debug
28 September 2026
An AI application can look healthy while users are receiving unhelpful answers. The API returns 200, the dashboard shows low latency, and costs appear normal. Yet retrieval may be returning the wrong policy, a tool call may be failing quietly, or a prompt change may have reduced answer quality for a valuable customer segment.
That is why AI application observability is more than conventional uptime monitoring. It is the practice of making the full path from user request to outcome understandable. For a business deploying an assistant, document processor, or workflow agent, that visibility protects user trust, helps teams improve faster, and prevents small quality problems from becoming expensive operational ones. It complements AI evaluation, which tells you whether a planned change is better before release.
This guide explains the signals worth collecting, alerts that deserve a human response, and a practical debugging approach that respects user privacy.
Why normal application monitoring is not enough
Traditional monitoring answers useful questions: is the service available, is the database slow, and did a deployment raise errors? AI systems add uncertainty at every stage. A model can produce a fluent but wrong answer. A retrieval system can return relevant-looking but stale context. A tool-using agent can take an unexpected path without producing a technical exception.
Teams commonly encounter these gaps:
- Invisible quality regressions. A new model or prompt shifts tone, completeness, or refusal behaviour without triggering an error rate alert.
- Unexplained cost growth. Longer contexts, retry loops, and tool calls can raise cost per successful task even when traffic is stable.
- Lost user confidence. Staff stop using an assistant after a few bad answers, but the product team has no evidence of where the journey failed.
- Privacy risk through over-logging. Capturing every raw request can create a second, poorly governed store of sensitive data.
Reliable enterprise RAG systems treat these as design requirements. Observability gives the team a shared, evidence-based way to improve the experience while preserving an audit trail.
Build a trace that follows the user outcome
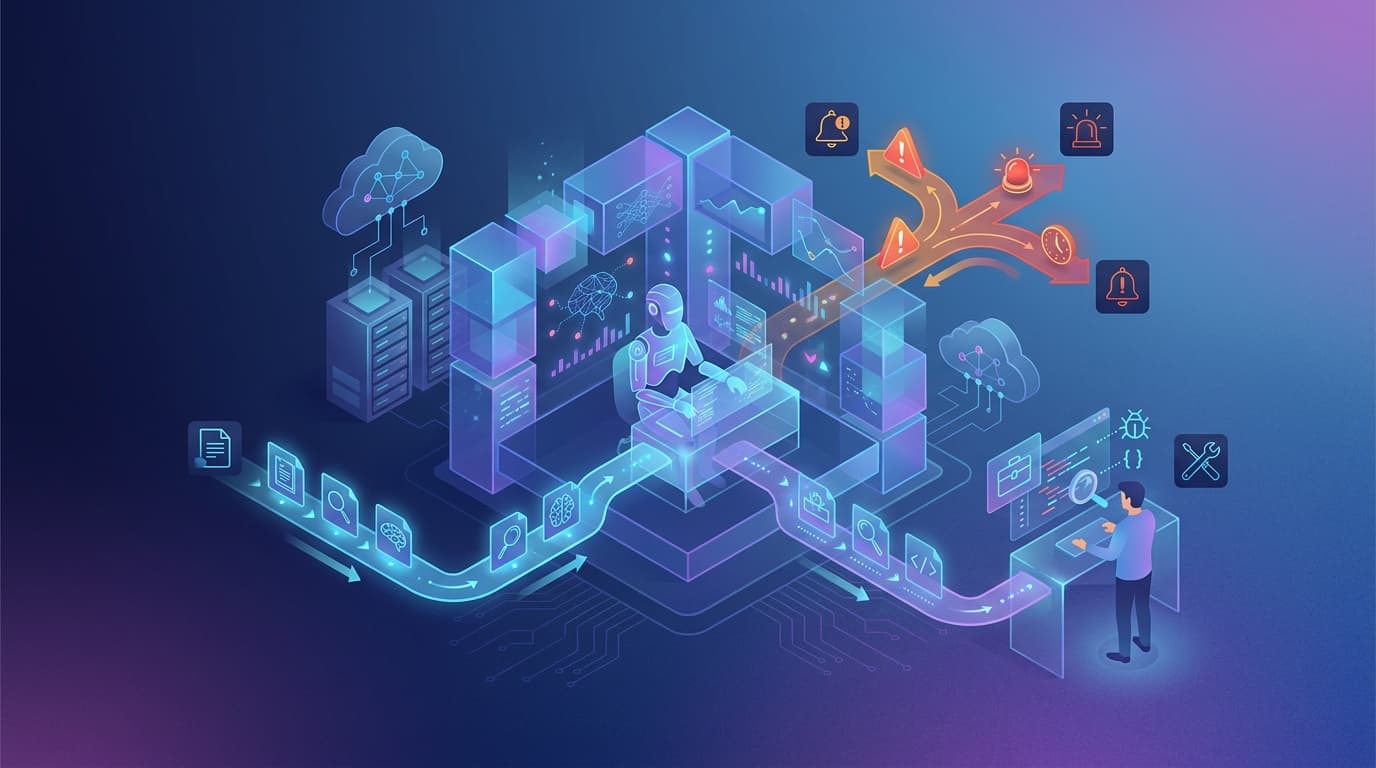
Start with a correlation ID for each interaction. Every model call, retrieval query, tool invocation, fallback, and final response should carry it. A trace lets a support or product owner inspect one failed interaction without searching unrelated logs.
Log the minimum useful context
Capture structured metadata rather than defaulting to raw conversational content. At minimum, record:
- request time, route, tenant or workspace pseudonym, and correlation ID
- model, prompt version, temperature, and system configuration
- input and output token counts, latency, retries, and estimated cost
- retrieval source identifiers, scores, document version, and permission-filter result
- tool name, arguments redacted where necessary, result status, and elapsed time
- user feedback, escalation, correction, or abandonment signal
This makes operational efficiency measurable. A team can see whether a slow answer came from retrieval, the model, or a downstream system. It can also compare cost and quality by workflow rather than treating AI spend as a single opaque number. Keep source documents and original data as the system of record. Logs should point to controlled records, not duplicate everything users submitted.
Measure quality alongside technical health
Availability, latency, and error rate still matter. Add product signals that describe whether the answer helped: grounded-answer rate, citation coverage, successful task completion, human handoff rate, and negative feedback rate. Segment these by use case, language, customer tier, or source collection where appropriate.
For example, a support assistant may show 99.9% availability while its grounded-answer rate falls after a knowledge-base migration. An alert based only on infrastructure would miss the incident. A quality dashboard makes the change visible before it damages adoption.
Alert on changes that require a decision
An alert should lead to a clear response. Paging people for normal model variation creates noise, while ignoring sustained changes creates risk. Define baselines from real traffic and alert on trends, not a single unusual completion.
Useful alerts include:
- a sustained increase in failed or timed-out tool calls
- a sharp drop in retrieval score, citation coverage, or verified task completion
- a rise in cost per completed task after a release
- repeated permission-filter failures or attempts to access restricted sources
- unusual prompt length, retry count, or abandonment for one workflow
Pair alerts with an owner and a runbook. If retrieval relevance drops, the first checks might be index freshness, document parsing changes, and permission metadata. If cost jumps, inspect context size and retry paths before simply moving to a cheaper model. This operational discipline is central to the real cost of running an AI agent, where avoidable retries and unmeasured quality both affect ROI.
Debug safely, then improve the system
A practical investigation begins with the trace. Reconstruct the path: what the user asked, what sources were eligible, what the model saw, what tools ran, and what was returned. Redact or role-restrict sensitive fields, retain data only as long as needed, and document who can access production traces. These controls align with GDPR-aware AI patterns, especially for systems handling customer or employee data.
Consider an operations team whose assistant gives an outdated shipping instruction. The trace reveals that retrieval found the new policy but ranked an older document higher because its status metadata was missing. The durable fix is not a prompt warning. It is a data-pipeline rule that requires a status field, excludes superseded documents, and adds the incident to the evaluation set. That is user-centric design in practice: solve the cause, not the symptom.
A sensible first 30 days
You do not need a sprawling telemetry platform to begin.
- Week one: map one high-value AI journey and add correlation IDs, latency, cost, model version, and outcome status.
- Weeks two and three: instrument retrieval and tools, define three quality measures, and review a small sample of traces with the people who use the workflow.
- Week four: set trend-based alerts, write runbooks, and add recurring failures to your evaluation dataset.
The goal is a robust, scalable feedback loop: users receive better outcomes, operators can explain failures, and leadership can see whether the investment is delivering value. If you are planning an AI product or need to make an existing one easier to trust, talk with Novemind about an observable AI architecture.
Related reading: